Vol. 34 N.º 2 (2025): Special Issue. Advancing Pro-Environmental Behavior: From the Workplace to Consumer Actions, Articles, ##plugins.themes.xejournal.article.pages## 10344
Governments and organizations encourage companies to measure and report their environmental impact. However, in Latin America, a standardized framework for companies to disclose environmental information has yet to be established. This article investigates changes in CO2 emission intensity and water usage, as well as the effects of corporate actions related to environmental mitigation and adaptation. To this end, we created two indices—one for adaptation and one for mitigation—using data from 672 publicly listed companies across six Latin American countries from 2017 to 2023. We conducted an analysis using a structural equation model to measure the effects on company value, water usage intensity, and CO2 emissions in relation to sales. The findings suggest that reported mitigation actions effectively reduced companies' CO2 intensity. However, no evidence was found that adaptation actions reduced water usage. These results are based on data from one-third of the listed companies that disclose environmental information. This group invested the equivalent of 0.70% of their sales in sustainability. Addressing climate change moving forward will require deeper engagement in new environmental actions and the involvement of a broader range of companies.
Palavras-chave:
Market value, Climate change, Information disclosure, Simultaneous equations, Emissions intensity
Rosas-Rodríguez and Kato-Vidal: Environmental disclosure: Mitigation and adaptation using ESG statistics from Latin
American public companies disclosure : Mitigation and adaptation using ESG statistics
from Latin American public companies
If a high-growth economy [more resources] is needed to fight the battle against pollution,
which itself appears to be the result of high growth, what hope is there of ever breaking
out of this extraordinary circle?
-E. F. Schumacher, 1973
1. INTRODUCTION
Governments and international organizations are addressing the climate crisis by working
to mitigate greenhouse gas emissions and curb global warming, while simultaneously
adapting to its current and future impacts, such as rising sea levels and extreme
weather events. To combat environmental degradation, companies are being urged to
adopt sustainable production practices. In response, many now measure and disclose
their environmental performance, enhancing transparency for stakeholders in decision-making
processes (). According to signaling theory, such disclosures act as a signal of proactive environmental
responsibility, which investors view favorably—potentially increasing company value
(; ; ).
In recent years, the proliferation of environmental metrics and standards has led
to dissatisfaction, reporting fatigue, and higher costs, as companies navigate diverse—and
often contradictory—sustainable accounting frameworks (). In Latin America, while most regulations mandate environmental risk reporting,
the region still lacks a standardized framework ().
This paper aims to construct two indices: one measuring CO₂ mitigation actions and
another assessing environmental adaptation initiatives, evaluating their impact on
the CO₂ and water usage embedded in sales. The mitigation index comprises 19 items,
while the adaptation index includes six. A secondary objective is to determine how
CO₂ emissions and water usage influence company value. The analysis uses data from
672 Latin American publicly listed companies sourced from the LSEG Workspace database,
spanning 2017–2023 (N = 4 705 observations).
Using a structural equation model, we analyze (i) the impact of CO₂ emission intensity
(per million dollars) and water usage on company value, and (ii) the effectiveness
of mitigation and adaptation indicators. Our findings reveal that CO₂ emission intensity
significantly affects firm value: a 1% increase in emissions leads to a 0.15% decline
in value (p = 0.000). In contrast, water usage does not exhibit a negative effect; instead, higher
water consumption is weakly but positively associated with company value (p = 0.000).
Further analysis of the model shows that mitigation strategies have been effective
in reducing emissions per million dollars of sales. However, the evidence on water
usage is less encouraging. While companies with high water consumption have adopted
most environmental adaptation measures, their overall impact remains limited.
The database allows for estimating the cost of environmental mitigation and adaptation
measures, which amounts to approximately 0.70% of sales (or 0.35% of value added).
Notably, Latin American companies allocate three times more resources to environmental
actions than to technological R&D ().
Prior research has examined various strategies to reduce corporate CO₂ emissions (see
Sections 2.1 and 2.3), often with a regional focus on Europe. Our study contributes
to this literature by (1) addressing the understudied context of Latin America, (2)
expanding the environmental analysis to include both CO₂ emissions and water usage
conservation, and (3) incorporating mitigation and adaptation indices as predictor
variables—a novel approach, given the scarcity of business literature discussing adaptation
actions specifically. The results confirm that these measures have successfully reduced
CO₂ emissions. However, greater efforts are still needed to monitor and curb corporate
water usage.
The remainder of this paper is organized as follows: Section 2 reviews the relevant
literature, Section 3 outlines the methodology—including variable definitions, the
construction of the mitigation and adaptation indices, and descriptive statistics.
Section 4 presents the empirical results of the structural equation model and discusses
the findings. Finally, Section 5 provides the concluding remarks.
2. LITERATURE REVIEW: CORPORATE DECISIONS, CLIMATE ADAPTATION AND MITIGATION
Corporations have frequently been associated with economic, labor, and environmental
controversies, often stemming from a narrow focus on profit maximization as their
core objective. This traditional shareholder-centric model has faced growing criticism,
particularly from stakeholder theory, which argues that neglecting broader societal
and environmental concerns is unsustainable in the long term (). In response to escalating environmental challenges, national governments and international
bodies have increasingly advocated for the adoption of the 2030 Sustainable Development
Goals (SDGs), which aim to reconcile economic growth with ecological preservation.
This shifting paradigm has elevated the importance of Environmental, Social, and Governance
(ESG) criteria over the past four decades, pushing corporations to adopt more sustainable
practices and responsible production methods.
2.1. DISCLOSURE OF CORPORATE ENVIRONMENTAL INFORMATION
The growing emphasis on corporate sustainability (; ) reflects increasing public awareness, corporate reputation concerns, and the imperative
to mitigate environmental and operational risks. Companies now demonstrate their commitment
through transparent disclosure practices and the adoption of comprehensive human rights
and environmental policies (). This shift originated from academic-professional collaborations that recognized
the impossibility of implementing effective Corporate Social Responsibility (CSR)
without first addressing an organization's fundamental social and ethical dimensions.
These efforts ultimately spurred the development of standardized methodologies for
assessing corporate performance across social, ethical, and environmental parameters
().
Corporate reporting has emerged as a critical transparency mechanism for disclosing
non-financial performance. This accountability framework helps organizations delineate
their social responsibility parameters while communicating relevant information to
stakeholders (). While disclosure practices vary globally, most jurisdictions now either mandate
or encourage non-financial reporting (). Current adoption rates reveal a significant gap - although only 19% of listed companies
worldwide publish sustainability reports, these firms account for 84% of global market
capitalization (), highlighting the disproportionate influence of large corporations in sustainability
disclosure practices.
Research on corporate governance, ESG disclosure, and stakeholder orientation remains
notably underdeveloped in Latin America and Mexico. Deeper examination of these areas
could elucidate critical relationships between governance structures and stakeholder
rights (). ESG disclosure practices vary considerably across the region: while Brazil and
Colombia emphasize climate-related reporting, other countries are increasingly focusing
on broader sustainability communication. Notably, 330 companies representing 83% of
the region's market capitalization now publish sustainability reports (). Sectoral differences are pronounced - in 2021, 89% of mining and mineral processing
firms disclosed sustainability information, compared to 61% of service sector companies
and 66% of transportation firms.
A striking regional distinction emerges in verification practices: while just 63%
of global companies employ third-party validation for their reports, this figure rises
to 93% among Latin American disclosers (). This verification gap underscores that while disclosure itself is important, the
credibility of reported metrics remains essential for investor assessment of sustainability
progress (). However, growing climate policy uncertainty has exacerbated greenwashing risks,
particularly in polluting industries within weakly regulated markets. Evidence suggests
that enhanced external regulatory pressures may effectively curb such practices ().
2.2. SUSTAINABILITY AND FIRM VALUE
Academic literature demonstrates a consistent negative relationship between carbon
emissions and firm valuation across multiple markets. established this inverse correlation in their analysis of 243 companies (2013-2019),
showing that carbon performance improvements positively affect market valuation. This
finding aligns with study of 2,323 U.S. firms (2007-2016), which confirmed that higher emission levels
decrease market value. The pattern persists in European markets, as documented using direct emissions data from 1,493 companies. Globally, reinforced these conclusions through their examination of 1,748 annual observations,
further validating the negative impact of emissions on corporate valuation.
These findings collectively suggest that stakeholders positively value effective carbon
management, particularly since emissions' negative impact on firm valuation is more
pronounced in countries with weaker environmental regulations (). This market preference for substantive action over symbolic gestures is further
evidenced by , whose analysis revealed that environmental disclosure indices lose statistical significance
when controlling for actual environmental performance. Their results indicate that
financial markets primarily assess corporate environmental behavior through measurable
emission outcomes rather than disclosure practices when determining company valuations.
In the Latin American context, analyzed 454 companies using environmental initiatives as an emissions proxy, revealing
that firms with stronger disclosure practices achieve both higher market valuations
and superior accounting performance. The researchers developed a comprehensive disclosure
index based on 50 binary indicators derived from environmental reports, where each
affirmative response contributed one point to the total score. This methodology generated
percentage scores ranging from 0% to 100%—for example, companies with 25 positive
responses received a score of 50%, enabling standardized cross-company comparisons
of disclosure quality.
While a significant correlation exists between ESG disclosure practices and carbon
emissions (), mere compliance with ESG reporting requirements does not necessarily translate
into better emissions performance. demonstrated this disconnect in their analysis of U.S. firms (2005-2018), showing
that higher ESG ratings failed to correlate with reduced emissions. This paradox stems
from market dynamics where investors disproportionately value sustainability reporting
itself— found that simply publishing such reports signals corporate sustainability, making
firms more attractive to investors regardless of their actual emissions control efforts
(; ). This creates a perverse incentive where companies may prioritize disclosure over
substantive environmental action.
2.3. RESPONSE TO CLIMATE CHANGE: ADAPTATION AND MITIGATION
Climate change mitigation refers to strategies aimed at counteracting the adverse
impacts of climate change, primarily by reducing greenhouse gas emissions () and slowing global warming. However, even full implementation of the Paris Agreement
pledges would still lead to a 3.2°C temperature rise by 2100 ().
Recognizing these limitations, since the 2010 Conference of the Parties (COP), mitigation
efforts have been complemented by adaptation strategies. Given that the cumulative
effects of climate change will persist for centuries, adaptation is critical for enhancing
resilience—developing capacities and reducing vulnerabilities in affected systems
(; ).
Mitigation strategies focus on reducing greenhouse gas (GHG) emissions, encompassing
corporate initiatives designed to curb their carbon footprint (; ). In contrast, adaptation strategies involve reactive or proactive measures taken
by firms to minimize climate-related risks and enhance their resilience. To assess
these adaptation efforts, evaluate both internal and external factors, including economic and environmental
performance, as well as regulatory compliance.
Research demonstrates that mitigation strategies effectively reduce emissions, with
studies identifying three primary approaches: Scope 1 (direct emissions), Scope 2-3
(indirect emissions from energy/value chains), and offsetting mechanisms (). While carbon-intensive firms tend to favor low-investment strategies like marginal
efficiency gains – which show limited transition potential – broader mitigation efforts
positively impact emissions performance. confirmed this through a study of 247 European carbon-intensive firms, analyzing
strategies including recycled materials, product redesign, energy efficiency, process
optimization, and emissions-reduction technologies.
While mitigation strategies have received substantially more attention than adaptation
efforts (), research specifically measuring adaptation’s impact remains scarce. However, some
studies have assessed adaptation through sustainability indices. For instance, demonstrate that higher ESG ratings enhance carbon efficiency, particularly in non-state-owned
and cleaner firms. Similarly, developed a disclosure index—based on 2 444 firm-year observations—tracking sustainable
initiatives like emission reductions, environmental innovations, and resource efficiency.
Their findings reveal that higher index scores correlate with lower GHG emission intensity,
especially in polluting industries.
2.4. USE OF RESOURCES: CO2, MATERIALS AND WATER
The literature demonstrates a strong emphasis on carbon emissions as the primary environmental
metric, with markets predominantly using this measure to assess firm value. This focus
has created a significant research gap regarding the valuation impacts of other critical
resources. While environmental regulations increasingly align with SDG principles—promoting
sustainable production without depleting natural resources—and despite 85% of global
investors prioritizing water management and climate action (), few studies examine non-carbon environmental factors. A notable exception is , who identified negative correlations between both water consumption and waste generation
with firm value, highlighting the need for broader environmental valuation metrics.
analyzed 76 284 observations from the Carbon Disclosure Project (CDP) spanning 2003-2020,
finding that carbon disclosure is significantly associated with reduced subsequent
emissions. However, revealed an important nuance: while climate disclosure ratings exert pressure on
poorly-rated firms to improve their reporting quality in subsequent years, these companies
show little propensity to actually reduce their emissions - particularly among those
with the lowest ratings.
Several studies have constructed environmental disclosure indices based on corporate
initiatives. developed an index assessing five key areas: (i) environmental management systems,
(ii) credibility, (iii) performance indicators, (iv) environmental expenditures, and
(v) environmental initiatives. The study found that companies with lower hazardous
waste volumes and active reduction programs achieved higher disclosure ratings. Similarly,
and created a Climate Performance Leadership Index with five components (management,
risks, emissions, opportunities, and approval), requiring a minimum score of 50 for
inclusion (n = 102 and n = 119 firms, respectively). Both studies revealed that higher emissions correlated
with lower carbon transparency, suggesting that stronger environmental performance
(lower emissions) drives greater disclosure.
Research on non-carbon resources remains limited, likely due to weaker compliance
requirements. Studies reveal significant gaps across sectors and regions: in France,
companies fail to report water extraction data (), while in China only 38% of listed firms disclose water metrics despite guidelines
(). The mining sector lacks consensus on baseline water consumption levels across regions,
hindering target-setting (). Even in energy transitions, the water-carbon nexus persists—low-carbon technologies
may increase water demand ().
Research on alternative environmental metrics remains scarce. found that European Union dematerialization efforts have largely failed, with material
resource reductions only occurring during the 2008 GDP contraction. In the electronics
sector, waste volume studies exist, but implementation gaps persist— show Mexico's environmental policies lack supporting regulatory frameworks, discouraging
proper resource management.
This literature review highlights a critical limitation: the overwhelming focus on
CO2 metrics neglects other vital resource measures, ultimately impeding progress toward
Environmental Sustainability Goals.
3. MATERIALS AND METHODS
3.1. DATA
This study evaluates the efficacy of environmental mitigation and adaptation initiatives
implemented by Latin American publicly traded companies from 2017 to 2023. While disclosure
rates have shown gradual improvement, they remain notably low relative to global standards.
The sample comprised firms from six countries (Argentina, Brazil, Chile, Colombia,
Mexico, and Peru). This group of countries accounts for approximately 480 million
inhabitants, representing about 76% of Latin America's population. The contribution
percentage is even higher (85%) when considering Gross Domestic Product as the variable
(). Although data were available for more countries, we restricted our sample to these
six nations to avoid introducing additional heterogeneity.
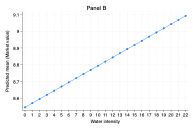
As illustrated in Figure 1, sample companies account for an average of 12% of national CO₂ emissions across
the six studied countries (Panel A). Chilean listed companies demonstrate disproportionately
higher emission contributions compared to regional peers. Regarding water resources
(Panel B), Brazil and Chile emerge as the dominant consumers among reporting firms.
Data from Argentina, Colombia, Mexico, and Peru were excluded from water usage analysis
as listed companies in these nations represent ≤0.5% of national withdrawals.
Figure 1
Note. a) In 2017 and 2023, 102 and 218 companies reporting CO2, respectively, and b) in 2017 and 2021, 90 and 171 companies reporting water, respectively.
Source: Authors’ elaboration using data from European Commission Emissions (2024) and Food and Agriculture Organization of the United Nations (2024).
The analysis draws on two primary data sources identified in the literature: Refinitiv
(; ) and the Carbon Disclosure Project (; ; ; ; ). For this study, we utilized the LSEG Workspace database (Refinitiv's successor),
which covers global listed companies.
Our sample selection process began with all companies listed on major Latin American
stock exchanges (n = 725). After excluding 53 firms (23 inactive/incomplete records, 17 with pre-2018
data, and 13 trusts), the final sample comprised 672 companies analyzed over seven
years (2017-2023), yielding 4 704 firm-year observations. Country-level distributions
are detailed in Appendix 1.
Despite mandatory ESG disclosure requirements for public companies, reporting remains
limited. Our sample construction required firms to disclose environmental indicators
in at least three reporting years (2018, 2020, 2023), yielding a final sample of 156
listed companies (n = 1 106 firm-year observations). Sectoral and geographical distributions are presented
in Appendix 1.
The environmental performance of companies signals market actors about sustainability
commitments, enhancing corporate reputation and investor appeal through demonstrated
reductions in pollution and improvements in resource efficiency (; ; ). This commitment operates through two distinct channels: mitigation actions (addressing
climate change causes) and adaptation measures (managing climate impacts across time
horizons). Our study focuses on analyzing how these mitigation and adaptation efforts
influence environmental outcomes (CO₂ emissions and water use), while secondarily
examining the relationship between resource efficiency and firm valuation. Accordingly,
our dependent variables comprise both environmental metrics (emissions and water withdrawal)
and financial performance (firm value).
Research Hypotheses
H1a: Mitigation actions have succeeded in reducing emissions. However, they have become
more effective since 2021.
H1b: If adaptation measures are effective, water use metrics should show an inverse
relationship.
H2: Investor perceptions respond differently to distinct environmental indicators.
H2a: Firm valuation is negatively associated with CO₂ emissions, as they represent
a direct measure of climate change exposure.
H2b: Higher water use leads to higher firm valuation, as lax regulatory scrutiny prevents
investors from imposing penalties for environmental externalities.
3.2. VARIABLES
3.2.1. DEPENDENT VARIABLES
This study uses emissions intensity—measured as CO₂ emissions (metric tons) per million
USD revenue—as the primary variable, since CO₂ represents the principal climate change
driver. This intensity metric standardizes emissions across companies, enabling comparisons
independent of firm size or industrial sector.
Alongside CO₂ emissions, three additional variables were initially evaluated: water
extraction, waste generation, and energy expenditure. Water extraction (measured in
cubic meters per million USD revenue) was ultimately selected as a secondary metric,
with lower values indicating greater efficiency. The waste variable was excluded due
to inconsistent reporting patterns across years, while energy expenditure was omitted
because of its strong correlation with emissions intensity (r = 0.70; Appendix 2), which would yield redundant information.
3.2.2. INDEPENDENT VARIABLES
Two indices were developed to examine corporate environmental impact: one measuring
mitigation efforts and another tracking adaptation actions. Data were extracted from
company ESG reports, which follow the Environmental, Social, and Governance framework
containing over 630 standardized metrics (). Each metric was coded as a binary variable (1 = action implemented, 0 = not implemented).
The environmental component comprises 437 metrics across three categories: (a) emissions-related
actions covering pollution control, waste management, and biodiversity protection;
(b) product innovation and green revenue generation; and (c) resource management addressing
water use, energy efficiency, sustainable packaging, and supply chain sustainability.
To ensure reliable analysis, only metrics reported by at least one-third of the sample
companies (n = 672) were included. For context, financial variables showed higher reporting rates,
with 520 to 565 companies disclosing such data annually between 2017 and 2023.
Climate change results primarily from greenhouse gas accumulation, with mitigation
representing deliberate human efforts to reduce CO₂ emissions (). Adaptation comprises behavioral and operational adjustments to address existing
and anticipated climate impacts. This cyclical process involves vulnerability assessment,
strategy implementation, and capacity building to enhance resilience (; ).
While the theoretical distinction between mitigation and adaptation is well-established,
practical classification of environmental actions proves challenging. To strengthen
the classification procedure, we supported our decisions using artificial intelligence
(AI). This approach ensured a uniform application of criteria, reducing bias and maximizing
consistency. Specifically, to label actions as mitigation or adaptation, we consulted
three well-recognized AI platforms—ChatGPT, Perplexity, and Claude.ai—to cross-validate
our classifications.
Each platform received standardized definitions and assigned percentage weights (0-100%)
indicating alignment with either category. Items receiving >50% mitigation weighting
from at least two platforms were classified as mitigation actions, resulting in 19
mitigation and 6 adaptation items (Appendix 3). This outcome reflects the current research emphasis on mitigation over adaptation
() and demonstrates the methodological value of AI-assisted classification in research.
Following the classification of items into mitigation and adaptation categories, both
indices were computed as weighted averages using identical methodological procedures
(see Equations 1 and 2).
(1)
where is the value of the mitigation action item per company and per year, taking the value
of 1 if the company performed the action and 0 otherwise, and is the normalized weight. The construction of the normalized weight can be found
in Appendix 4.
(2)
where is the value of the adaptation action item per company and per year, taking the value
of 1 if the company performed the action and 0 otherwise, and is the normalized weight (Appendix 4).
The analysis incorporates control variables consistent with established literature
(; ; ; ; ). Complete variable definitions and operationalizations are provided in Table 1, which corresponds to the specifications in Equations 3 through 5.
Table 1Description of Variables Source: Authors’ elaboration using data from LSEG Workspace (LSEG, 2023 & 2024) and Benkraiem et al. (2022), Choi and Luo (2021), Nurul Houqe et al. (2022), Perdichizzi et al. (2024), and Wu et al. (2022).
Variables
Definition
Unit
a) Response variables
Emissions intensity
Logarithm of total carbon dioxide (CO2) emissions and CO2 equivalents relative to revenue generated in millions of dollars.
CO2 ton/ Revenue in millions of USD
Water intensity
Logarithm of total water extraction (total water extraction in cubic meters divided
by net sales or revenue in million US dollars) relative to revenue generated in millions
of dollars.
Cubic meters/ Revenue in millions of USD
b) Explanatory variables
Mitigation (0-100)
Mitigation index is the sum of the 19 mitigation action items per firm and per year
(each dummy variable item equals 1 if the company performs the action and 0 otherwise),
multiplied by a normalized weight. The normalized weight is formed by an attenuator
that reduces the difference between companies that report extensively and those that
do not, without equalizing them.
Percentage
Adaptation (0-100)
Adaptation index is the sum of the 6 adaptation action items per company and per year
(each dummy variable item equals 1 if the company performs the action and 0 otherwise),
multiplied by a normalized weight. The normalized weight is formed by an attenuator
that reduces the difference between companies that report extensively and those that
do not, without equalizing them.
Percentage
c) Control variables
Market value
Market value: Share price multiplied by the number of ordinary shares in issue.
Millions of USD
Cash Flow
Revenue before discontinued operations & extraordinary items and depreciation
Millions of USD
Ebit (ebit)
It is the natural logarithm of Earnings before Interest & Taxes
Millions of USD
Return on Assets
Revenue before taxes /Total Assets
Percentage
Leverage
Total debt divided by the value of Shareholders equity
Percentage
Revenue
It is the natural logarithm of Total Revenue
Millions of USD
Post
Post=1 when the years are 2021-2023, Post=0 when the years are 2017-2020
Millions of USD
Source: Authors’ elaboration using data from LSEG Workspace (LSEG, & ) and , , , , and .
3.3. MODEL SPECIFICATION
A structural equation model (SEM) was developed to assess (i) the impact of resource
use—specifically emissions intensity and water extraction intensity—on firm value
(Equation 3, Hypothesis 2) and (ii) the effect of mitigation and adaptation actions on environmental
performance (equations 4 and 5). Equation 3 evaluates how a company’s market value responds to changes in emissions and water
intensity, while Equations 4 and 5 estimate the influence of mitigation and adaptation measures on emissions intensity
and total water extraction intensity, respectively.
(3)
(4)
(5)
where the dependent variables are market value (MV), emissions intensity (co2_int) and water intensity (h2o_int). MV is the market capitalization value, co2_int refers to total emissions relative to revenue, and h2o_int refers to water withdrawal relative to revenue. Additionally, mitigit is the mitigation index and adaptit the adaptation index; xit represents a set of control variables including cash flow, ROA, Leverage y Ebit. Postit is a dummy variable representing a value of 1 for the years post-2020 and 0 for the
preceding years. Indit is a dummy variable representing each industry.
The structural equation model included mitigation and adaptation actions in both Equations 4 and 5, but with distinct nonlinear specifications reflecting their different climate-related
focuses. For Equation 4 (emissions intensity), we incorporated only the quadratic term of mitigation actions
to capture their nonlinear effect on CO₂ reduction, as these actions directly target
climate change mitigation. Conversely, Equation 5 (water extraction intensity) included the quadratic term of adaptation actions to
assess their nonlinear impact on water use, consistent with their focus on addressing
climate change consequences. This specification acknowledges that while both strategies
were evaluated in each equation, their relative importance differs based on the environmental
outcome being measured.
3.4. SUMMARY STATISTICS
The analysis used data from 2017 to 2023 to examine temporal trends. For comparison,
the period was divided into two groups: pre-2021 and 2021–2023. This division was
based on reporting patterns—only 17% of companies disclosed environmental information
in the early years, while reporting rates increased significantly to 25% from 2021
onward. By comparing these periods, the study provides clearer insights into evolving
trends and stronger evidence for recent developments.
Appendix 5 provides the descriptive statistics for the study variables. Overall, the mitigation
index scores were consistently higher than those of the adaptation index. At the start
of the study period (2017), the highest mitigation values were observed in the Mining,
Extraction, Public Services, and Construction sectors (37 out of 100) and the Manufacturing
sector (51 out of 100). By 2021, these values had risen to 66 and 70, respectively.
In contrast, the Commerce and Services sectors (Sectors 4 and 5) showed lower initial
scores (32 and 36 in 2017) but demonstrated the most significant growth, nearly doubling
their values to 54 and 67 by 2021.
The increased corporate disclosure coincided with substantial improvements in mitigation
efforts, with the most notable progress occurring between 2017 and 2021. By contrast,
advances in 2023 were marginal. During this most recent period, all sectors converged
around an average mitigation score of 70, with peak sector-specific values reaching
as high as 90 out of 100.
In contrast to the mitigation trends, the adaptation index showed more consistent
progress across industries in both 2021 and 2023, with smaller inter-sector disparities.
The Mining, Utilities, and Construction sector (initial score: 39) and Manufacturing
sector (46) demonstrated stronger initial performance compared to the Trade, Transport,
and Storage sector (28) and Services sector (31). By 2021-2023, these scores had risen
substantially to 65 and 75 for the first group, and to 50 and 60 for the second group
(all scores out of 100).
Sectoral analysis revealed distinct environmental efficiency patterns, with Agriculture,
Mining, and Manufacturing consistently exhibiting the highest emissions and water
intensities. While Agriculture and Mining reduced CO₂ emissions by 2023, these gains
failed to offset their 2021 increases, leaving Manufacturing as the only high-emission
sector demonstrating sustained improvement. Among low-emission sectors, only Trade
achieved measurable progress in emissions reduction. Water intensity patterns diverged,
with Agriculture showing increased consumption while the other four sectors reduced
their water use. These findings highlight sector-specific challenges in environmental
performance, particularly the lagging adaptation of water-intensive sectors compared
to emissions reduction efforts.
4. RESULTS AND DISCUSSION
This section presents the Structural Equation Model regression results. Table 2 displays the empirical estimates for Equations 3-5, based on a balanced panel of companies that consistently reported environmental
data throughout the study period.
The initial estimation results are presented in Appendix 6. We observe that the model exhibited multicollinearity issues, and a high variance
inflation factor due to the interaction between the adaptation index and the sector
(Equation 5) and the squared mitigation index (Equation 4). Additionally, during the review process, it was suggested that we incorporate Tobin’s
Q to enhance the robustness of the analysis. Consequently, Appendix 7 presents an estimation in which, for Equation 3, market value is replaced by Tobin's Q. Our model comparison supported retaining
market value and using the Table 2 estimates.
To address multicollinearity, an instrumental variable (IV) was used for the emissions
variable in Equation 3. The instrument consisted of Scope 3 emissions (emissions for which a company is
indirectly responsible) relative to total assets. This instrumented variable is highly
correlated with total emissions and weakly correlated with market value. Additionally,
in Equation 4, the mitigation index was replaced by its first lag to address reverse causality.
Table 2 presents the estimation results, where we exclude the squared term of the mitigation
index in Equation 4, and omit the interaction between the adaptation index and the sector in Equation 5.
The results from Column 1 (Table 2), examining firm value as the dependent variable, reveal two key findings: First,
a 1% increase in emission intensity corresponds to a significant 0.15% decrease in
firm value (Panel A, Figure 2). Second, water extraction intensity shows a contrasting positive effect, increasing
firm value by 0.02% (Panel B, Figure 2). These results suggest investors pay closer attention to emissions - the climate
change-related variable - when valuing firms. The control variables exhibit expected
relationships: ROA and leverage show negative associations (; ; ), while cash flow demonstrates a positive effect ().
Column 2 analyzes the impact of mitigation actions on emissions intensity, revealing
a significant negative relationship. Each one-unit increase in mitigation actions
reduces emissions intensity by up to 2.26% (Table 2), demonstrating their substantial effectiveness.
The curves in Figure 3 (Panel A Emissions) show that from 2017-2020, companies experienced slower CO₂ reductions.
From 2021-2023, these companies showed faster reductions, indicating that mitigation
actions have become more effective at lowering emissions. The average mitigation index
rose from 51.7 (2017-2020) to 69.02 (2021-2023). After 2020, when larger companies
began reporting, the effect became 38% stronger.
These findings align with recent literature, particularly , who document peak emissions attainment across multiple economies. The observed emissions
intensity reduction also corresponds with projections of global emissions peaking during 2020-2025. Notably, this study demonstrates
declining emissions intensity despite concurrent revenue growth, suggesting successful
decoupling of economic activity from environmental impact.
Column 3 reveals a counterintuitive positive relationship between adaptation actions
and water extraction intensity, with each unit increase in the adaptation index associated
with up to a 6.75% rise in water use.
The nonlinear pattern in Figure 3 (Panel B Water) further shows temporal differences in this relationship: during 2017-2021,
water intensity grew at slower rates for firms with low adaptation indices compared
to the accelerated growth observed during 2021-2023 for comparable firms.
The analysis reveals a plateau effect when the adaptation index approaches 80, where
water intensity stabilizes rather than decreases. This stagnation suggests diminishing
returns of adaptation measures on water conservation at higher implementation levels.
The data show significant temporal progression in adaptation efforts, with average
index scores rising from 45.49 during 2017-2020 (dashed reference line) to 65.44 in
the 2021-2023 period (scale: 0-100).
Table 2Estimation of the structural model of emissions and water intensity, company value
and mitigation and adaptation actions Source: Authors’ elaboration. Standard errors in parentheses.
Source: Authors’ elaboration. Standard errors in parentheses.
Note. ** p<.01
* p<.05
Weighted using the emissions. The correlation between the instrument and emissions
was 0.82, while its correlation with market value was close to zero (-0.009).
Figure 2
Source: Authors’ elaboration. The predictions are based on the Table 2 estimates.
Figure 3
Source: Authors’ elaboration. The predictions are based on the Table 2 estimates.
The environmental catalog provided to stock exchanges remains incomplete, suggesting
additional opportunities exist for water reduction beyond currently reported strategies.
While our findings demonstrate measurable progress from unverified approaches, the
specific methods cannot be precisely identified from available data. Potential undocumented
improvements may include infrastructure upgrades, irrigation optimization and soil
moisture monitoring, water-efficient process reengineering, conservation awareness
programs, dry industrial cleaning methods, and water-minimizing product redesigns
in manufacturing processes.
These findings align with , , and , confirming that while companies benefit from reputational gains through environmental
reporting, substantive ecological commitments remain limited. The evidence reveals
a clear prioritization imbalance: stakeholders heavily scrutinize emissions data for
valuation purposes, while water intensity metrics—despite their environmental significance—currently
fail to meaningfully influence corporate valuation decisions.
The control variables demonstrate the expected significant relationships with environmental
performance: ROA exhibits a negative association with emissions intensity (), cash flow is inversely related to CO₂ levels (), and leverage shows a consistent negative effect (; ; ). These results align with prior findings on the financial determinants of corporate
environmental impact.
These findings paint a concerning picture of limited regional progress in curbing
CO₂ emissions. The low uptake of recommended mitigation measures appears linked to
a persistent tolerance for high carbon intensity in business operations. This trend
is particularly notable given the robust 12.8% annual sales growth among large Latin
American publicly-traded companies, suggesting that economic expansion has not been
accompanied by proportional environmental improvements.
Analysis of water usage patterns reveals two key findings: First, companies with elevated
water consumption levels demonstrate more frequent adoption of adaptation measures.
Second, and more significantly, the volume of water withdrawal shows no statistically
meaningful correlation with corporate market valuation.
Reported environmental expenditures provide a proxy measure for corporate compliance
efforts with these indices. This comprehensive variable captures: (i) capital investments
and operational costs for environmental protection, and (ii) expenditures related
to preventing, mitigating, and controlling environmental impacts and risks. For comparative
analysis, the absolute expenditure value was normalized by dividing it by total company
revenue.
The analysis included 672 companies, of which only 76 (11.3%) disclosed environmental
expenditure data in 2023. After excluding two outliers with environmental expenditures
exceeding 20-40% of revenue, the final sample comprised 74 firms. Within this group,
53 companies (representing one-third of the full reporting panel) provided complete
mitigation and adaptation data. Results indicate these environmentally transparent
firms allocate an average of 0.7% of annual revenue to environmental expenditures.
When sustainability investment is estimated at 0.7% of revenue (equivalent to ≈0.35%
of corporate GDP), it represents a substantial commitment—approximately triple the
level of business expenditure on R&D (BERD) in Latin America (averaging 0.10% of GDP).
Notably, Brazil's BERD slightly exceeds this regional benchmark (). This comparative analysis suggests that Latin American firms prioritize sustainability
investments over innovation spending at a ratio of 3:1.
This study highlights critical gaps in corporate environmental engagement across Latin
America. While 25% of large companies consistently reported environmental actions
in 2023, the majority lacked transparent commitments or measurable goals. The data
reveal a clear divergence in effectiveness: mitigation efforts successfully reduced
CO₂ intensity (per $1M sales) between 2017–2023, whereas adaptation actions failed
to curb either water usage or emissions. Despite the existence of ESG guidelines for
nearly a decade, regional progress lags behind global self-regulation trends in financial
markets. More ambitious short-term sustainability targets—particularly for CO₂ and
water reduction—could be achieved through coordinated government policies to steer
the private sector toward meaningful environmental accountability.
5. CONCLUSIONS
This study analyzes environmental disclosures from Latin American publicly traded
companies to develop mitigation and adaptation indices, evaluating how enhanced environmental
compliance affects CO₂ emissions and water extraction intensity. Against the backdrop
of global climate action initiatives, corporate environmental practices exhibit substantial
variation - a feature we leverage to empirically assess effectiveness, communicate
performance outcomes, and identify transferable best practices for sustainable operations.
The analysis reveals a predominant focus on mitigation over adaptation, with most
environmental actions targeting emissions reduction and only limited measures addressing
water conservation. Our estimates demonstrate a significant inverse relationship between
mitigation implementation and CO₂ emissions, particularly when normalized by sales
to enable cross-sectoral comparison. The results highlight: (1) prior mitigation efforts
yield emissions reductions, (2) this lagged effect has become more pronounced since
2021, (3) if this linear effect continues and more companies start disclosing their
environmental impact, significant progress could be made towards decarbonization (H1a).
The second analytical strand examined the efficacy of adaptation measures, revealing
no significant reduction in water usage despite increased implementation of such actions
(H1b). Further investigation identified industry-specific water demand as a critical
factor - water-intensive industries reported more adaptation activities, while less
water-dependent sectors implemented fewer measures. Consequently, meaningful progress
in water conservation would require expanded adaptation initiatives among traditionally
low-water-use industries to complement existing practices in water-intensive sectors.
Reducing CO₂ emissions is both environmentally essential and a driver of corporate
market value (H2a). In contrast, water stewardship appears to lack financial rewards.
Surprisingly, our statistical evidence reveals a positive association between water
usage and market valuation among firms—indicating no signs of environmental adaptation
nor market penalties for high water use (H2b).
While corporate environmental disclosures offer valuable insights into resource use
patterns and climate response measures, data availability remains limited. Only approximately
one-third of publicly traded companies currently provide detailed environmental information,
constraining comprehensive assessment of sector-wide performance.
The low proportion of companies sharing environmental data limits robust regional
analysis of resource use and emissions. For context, we hypothesize that non-disclosing
firms likely exhibit weaker climate commitments and fewer decarbonization efforts
than their reporting counterparts. Without mandatory disclosure, their mitigation
activities are probably minimal compared to systematic reporters.
Effective climate action requires collaborative governance, yet Latin America faces
significant challenges in forging productive public-private environmental partnerships.
While corporate disclosures primarily serve investor needs, they also represent a
critical policy resource - particularly given that major corporations generate 67%
of global emissions (). This dual utility underscores the urgent need to transform voluntary reporting
into a foundation for coordinated climate strategy.
The results derive from a comprehensive database of self-reported information provided
by companies. To ensure reliability of the estimates, researchers prepared a balanced
panel that included the same companies each year. Many questions remain for investigation.
For example, estimates could compare companies that present environmental reports
with those that do not. Additionally, the self-reported figures from companies could
be verified against official statistics for each country. Furthermore, analysis could
explore intertemporal relationships in the estimated equations. Examining these aspects
would generate stronger evidence regarding progress and effectiveness of the business
sector in environmental matters.
Future research in Latin America should prioritize the metrics most frequently reported
by companies, as outlined in the adaptation and mitigation indices. By aligning these
metrics with existing regulatory frameworks, scholars could develop simplified, standardized
reporting systems. Such frameworks would likely increase participation among companies
that currently do not disclose environmental data.
Acknowledgements
This research was funded by FONFIVE (FCA202405) of the Autonomous University of Queretaro.
The authors gratefully acknowledge the financial support of the Autonomous University
of Queretaro.
Author contributions
Conceptualization, B.R. and E.K.; Data curation, B.R.; Formal analysis, B.R.; Funding
acquisition, B.R.; Investigation, B.R. and E.K.; Methodology, B.R. and E.K.; Writing-original
draft, B.R. and E.K.; Writing-review editing, E.K. All authors read and agree with
the published version of the manuscript.
References
1
Alonso Fernández, P., Regueiro Ferreira, R. M., & Doldán García, X. R. (2024). Dematerialization
and the economic crisis – are they parallel paths? Assessments based on the EU-15
case study. Revista Galega De Economía, 33(2), 1-20. https://doi.org/10.15304/rge.33.2.9281
2
Alsayegh, M. F., Abdul Rahman, R., & Homayoun, S. (2020). Corporate Economic, Environmental,
and Social Sustainability Performance Transformation through ESG Disclosure. Sustainability, 12(9), 3910. https://doi.org/10.3390/su12093910
3
Arif Khan, M. (2022). ESG disclosure and Firm performance: A bibliometric and meta
análisis. Research in International Business and Finance, 61, 1-19. https://doi.org/10.1016/j.ribaf.2022.101668
4
Baratta, A., Cimino, A., Longo, F., Solina, V., & Verteramo, S. (2023). The Impact
of ESG Practices in Industry with a Focus on Carbon Emissions: Insights and Future
Perspectives. Sustainability, 15, 6685. https://doi.org/10.3390/su15086685
5
Benkraiem, R., Shuwaikh, F., Lakhal, F., & Guizani, F. (2022). Carbon performance
and firm value of the World’s most sustainable companies. Economic Modelling, 116, 1-12. https://doi.org/10.1016/j.econmod.2022.106002
6
Bersalli, G., Tröndle, T. & Lilliestam, J. (2023). Most industrialised countries have
peaked carbon dioxide emissions during economic crises through strengthened structural
change. Communication Earth & Environment, 4(44). https://doi.org/10.1038/s43247-023-00687-8
7
Bose, S. (2020). Evolution of ESG Reporting Frameworks. In D.C. Esty, T. Cort (Eds.),
Values at Work Sustainable Investing and ESG Reporting. Palgrave Macmillan. https://doi.org/10.1007/978-3-030-55613-6
8
Brogi, V., & Lagasio, V. (2018). Environmental, social, and governance and company
profitability: Are financial intermediaries different? Corporate Social Responsibility and Environmental Management, 26(3), 576-587. https://doi.org/10.1002/csr.1704
Cadež S, Czerny A, & Letmathe P. (2019). Stakeholder pressures and corporate climate
change mitigation strategies. Business Strategy and Environment, 28, 1–14. https://doi.org/10.1002/bse.2070
11
Cadež, S., & Czerny, A. (2015). Climate change mitigation strategies in carbon-intensive
firms. Journal of Cleaner Production, 112(5), 4132-4143. https://doi.org/10.1016/j.jclepro.2015.07.099
12
Choi, B., & Luo, L. (2021). Does the market value greenhouse gas emissions? Evidence
from multi-country firm data. The British Accounting Review, 53(1), 1-24. https://doi.org/10.1016/j.bar.2020.100909
13
Cohen, S., Kadach, I. & Ormazabal, G. (2023). Institutional investors, climate disclosure,
and carbon. Journal of accounting and Economics, 76, 1-35. https://doi.org/10.1016/j.jacceco.2023.101640
Flammer, C., Toffel, M. W., & Viswanathan, K. (2021). Shareholder activism and firms'
voluntary disclosure of climate change risks. Strategic Management Journal, 42(10), 1850–1879. https://doi.org/10.1002/smj.3313
17
Freeman, R. E., Harrison, J. S., Wicks, A. C., Parmar, B. L., & Colle S. (2010). Stakeholder Theory. The State of Art. Cambridge University Press.
18
Giannarakis, G., Konteos, G., Sariannidis, N., & Chaitidis, G. (2017). The relation
between voluntary carbon disclosure and environmental performance: The case of S&P
500, International Journal of Law and Management, 59(6), 784-803. https://doi.org/10.1108/IJLMA-05-2016-0049
19
Giannarakis, G., Zafeiriou, E., & Sariannidis, N. (2017). The Impact of Carbon Performance
on Climate ChangeDisclosure. Business Strategy and the Environment, 26, 1078–1094. https://doi.org/10.1002/bse.1962
20
Gibassier, D. (2018). Corporate Water Accounting, Where Do We Stand? The International
Water Accounting Field and French Organizations. Sustainability Accounting, 31-65. https://doi.org/10.1108/S1479-359820180000007002
21
González, M., Guzmán, A., y Téllez, D. F. (2021). What you say and how you say it:
Information disclosure in Latin American firms. Journal of Business Research, 127, 427-443. https://doi.org/10.1016/j.jbusres.2019.05.014
22
Guastella, G., Mazzarano, M., Pareglio, S.& Spani, R. C. (2022). Do environmental
and emission disclosure affect firms’ performance? Eurasian Business Review, 12, 695–718. https://doi.org/10.1007/s40821-021-00195-9
23
Haque, F., & Ntim, C. G. (2022). Do corporate sustainability initiatives improve corporate
carbon performance? Evidence from European firms. Business Strategy and the Environment, 31(7), 3318–3334. https://doi.org/10.1002/bse.3078
24
Husted, W. B., & de Sousa, J. M. (2019). Board structure and environmental, social,
and governance disclosure in Latin America. Journal of Business Research, 102, 220-227. https://doi.org/10.1016/j.jbusres.2018.01.017
25
Iatridis, G. E. (2013). Environmental Disclosure Quality: Evidence on Environmental
Performance, Corporate Governance and Value Relevance. Emerging Markets Review, 14, 55-75. https://doi.org/10.1016/j.ememar.2012.11.003
26
Intergovernmental Panel on Climate Change [IPCC] (2023). Climate Change 2023: Synthesis Report. Contribution of Working Groups I, II and III
to the Sixth Assessment Report of the Intergovernmental Panel on Climate Change. IPCC. https://doi.org/10.59327/IPCC/AR6-9789291691647
Juhola, S., Laurila, A.G., Groundstroem, F., & Klein, J. (2024). Climate risks to
the renewable energy sector: Assessment and adaptation within energy companies. Business Strategy and the Environment, 33(3), 1906–1919. https://doi.org/10.1002/bse.3580
29
Lee, M. T., Raschke, R. L., & Krishen, A. S. (2022). Signaling green! firm ESG signals
in an interconnected environment that promote brand valuation. Journal of Business Research, 138, 1–11. https://doi.org/10.1016/j.jbusres.2021.08.061
López Pérez, S. de J. (2024). Circular business models for the electrical and electronics
equipment and e-waste sector. Measures for their dissemination and implementation
in Mexico. Revista Galega de Economía, 33(2), 1-23. https://doi.org/10.15304/rge.33.2.9455
33
Macknick, J., Newmark, R. Heath, G., & Hallett, C. (2012). Operational water consumption
and withdrawal factors for electricity generating technologies: a review of existing
literatura. Environment Research Letters, 7(4), 1-11. https://doi.org/10.1088/1748-9326/7/4/045802
34
Moliterni, F. (2018). Do Global Financial Markets Capitalise Sustainability? Evidence
of a Quick Reversal. Fondazione Eni Enrico Mattei, Working Paper 025.2018. http://www.jstor.com/stable/resrep21760
35
Mustafa Khan, H. & Mohd Ali, N. J. (2023). Regulations on Non-Financial Disclosure
in Corporate Reporting: A Thematic Review. Sustainability, 15, 1-23. https://doi.org/10.3390/su15032793
36
Northey, S. A., Muddb. G. M., Werner, T. T. Nawshad, H., Yellishetty, M. (2019). Sustainable
water management and improved corporate reporting in mining. Water Resources and Industry, 21, 1-20. https://doi.org/10.1016/j.wri.2018.100104
37
Nurul Houqe, M., Opare, S., Zahir-ul-Hassan, M. K., Ahmed, K. (2022). The Effects
of Carbon Emissions and Agency Costs on Firm Performance. Journal of Risk and Financial Management, 15(152), 1-17. https://doi.org/10.3390/jrfm15040152
38
OECD. (2023). Sustainability Policies and Practices for Corporate Governance in Latin
America, Corporate Governance. https://doi.org/10.1787/76df2285-en
Ortega-Ruiz, G., Mena-Nieto, A., Golpe, A. A., García-Ramos, J. E. (2022). CO2 emissions
and causal relationships in the six largest world emitters. Renewable and Sustainable Energy Reviews, 162, 1-15. https://doi.org/10.1016/j.rser.2022.112435
41
Perdichizzi, S., Buchetti, B., Cicchiello, A. F., Dal Maso, L. (2024). Carbon emission
and firms’ value: Evidence from Europe. Energy Economics, 131, 1-11. https://doi.org/10.1016/j.eneco.2024.107324
42
Quian, Y. & Liu, Y. (2024). Improve carbon emission efficiency: What role does the
ESG initiatives play? Journal of Environmental Management, 367, 1-13. https://doi.org/10.1016/j.jenvman.2024.122016
43
Rivera, J., Hoon, C., Oetzel, J., Clement, V. (2022). Business Adaptation to Climate Change. Cambridge University Press.
44
Sharifi, A. (2021). Co-benefits and synergies between urban climate change mitigation
and adaptation measures: A literature review. Science of the Total Environment, 750, 1-17. https://doi.org/10.1016/j.scitotenv.2020.141642
45
Simionescu, L.N., Gherghina, Ș.C., Sheikha, Z., & Tawil, H. (2020). Does Water, Waste,
and Energy Consumption Influence Firm Performance? Panel Data Evidence from S&P 500
Information Technology Sector. International Journal of Environmental Research and Public Health, 17, 1-29. https://doi.org/10.3390/ijerph17145206
46
Spence, A. Michael. (1973). Job Market Signaling. The Quarterly Journal of Economics, 87(3), 355–374 https://doi.org/10.2307/1882010
47
Treepongkaruna, S., Au Yong, H. H., Thomsen, S., & Kyaw, K. (2024). Greenwashing,
carbon emission, and ESG. Business Strategy and the Environment, 33(8), 1–14. https://doi.org/10.1002/bse.3929
48
Wu, S., Xinyi, L., Du, X., & Li, Z. (2022). The Impact of ESG Performance on Firm
Value: The Moderating Role of Ownership Structure. Sustainability, 4, 1-22. https://doi.org/10.1016/j.bir.2022.11.006
49
Zeng, H., Zhang, T., Zhifang, Z., Zaho, Y., & Chen, X. (2019). Water disclosure and
firm risk: Empirical evidence from highly water‐sensitive industries in China. Business Strategy and the Environment, 29(1), 17-38. https://doi.org/10.1002/bse.2347
50
Zhang, Z. & Ge, Z. (2024). Fishing in muddy water? Climate policy uncertainty and
corporate greenwashing in environmental, social, and governance. Managerial and Decision Economics, 45(6), 4191–4207. https://doi.org/10.1002/mde.4254
Appendices
Appendix 1. Total and sample firms by sector and country
Source: Authors’ elaboration using data from LSEG Workspace (LSEG, 2024).
Sector
Argentina
Brazil
Chile
Colombia
Mexico
Peru
672 firms
Agriculture
3
3
6
2
0
1
Mining
20
68
34
10
20
26
Manufacture
25
91
37
13
33
29
Trade
5
51
21
1
21
6
Services
6
78
25
3
31
5
Total
59
289
123
29
105
67
165 firms (sample)
Agriculture
1
1
0
0
0
0
Mining
7
16
8
5
2
7
Manufacture
5
22
7
4
12
3
Trade
1
16
6
1
10
3
Services
2
9
3
1
4
0
Total
16
64
24
11
28
13
Source: Authors’ elaboration using data from LSEG Workspace ().
Appendix 2.A Correlation
Source: Authors’ elaboration using data from LSEG Workspace (LSEG, 2024).
Source: Authors’ elaboration using data from LSEG Workspace ().
Note. *** p<0.01,
** p<0.05,
* p<0.1
Appendix 2.B Correlation between emissions intensity and energy intensity
Source: Authors’ elaboration using data from LSEG Workspace (LSEG, 2024).
Appendix 3. Items description for Mitigation and Adaptation indexes (Dummies)
Source: Authors' analysis of LSEG Workspace data (LSEG, 2023).
Mitigation items
Description
Resource Reduction Policy
1 if the company has a policy for reducing the use of natural resources or to lessen
the environmental impact of its supply chain, 0 otherwise.
Policy Energy Efficiency
1 if the company has a policy to improve its energy efficiency, 0 otherwise.
Policy Sustainable Packaging
1 if the company has a policy to improve its use of sustainable packaging, 0 otherwise.
Policy Environmental Supply Chain
1 if the company has a policy to include its supply chain in the company's efforts
to lessen its overall environmental impact, 0 otherwise.
Resource Reduction Targets
1 if the company set specific objectives to be achieved on resource efficiency, 0
otherwise.
Targets Energy Efficiency
1 if the company set targets or objectives to be achieved on energy efficiency, 0
otherwise.
Environment Management Team
1 if the company has an environmental management team, 0 otherwise.
Environmental Materials Sourcing
1 if the company claims to use environmental criteria (e.g., life cycle assessment)
to source or eliminate materials, 0 otherwise.
Renewable Energy Use Ratio
1 if the company makes use of renewable energy, 0 otherwise.
Green Buildings
1 if the company reports about environmentally friendly or green sites or offices,
0 otherwise.
Environmental Supply Chain Management
1 if the company uses environmental criteria (ISO 14000, energy consumption, etc.)
in the selection process of its suppliers or sourcing partners, 0 otherwise.
Env Supply Chain Partnership Termination
1 if the company reports or shows to be ready to end a partnership with a sourcing
partner, if environmental criteria are not met, 0 otherwise.
Policy Emissions
1 if the company has a policy to improve emission reduction, 0 otherwise.
Targets Emissions
1 if the company set targets or objectives to be achieved on emission reduction?;
0 otherwise.
Waste Reduction Initiatives
1 if the company reports on initiatives to recycle, reduce, reuse, substitute, treat
or phase out total waste, 0 otherwise.
e-Waste Reduction
1 if the company reports on initiatives to recycle, reduce, reuse, substitute, treat
or phase out e-waste, 0 otherwise.
Staff Transportation Impact Reduction
1 if the company reports on initiatives to reduce the environmental impact of transportation
used for its staff, 0 otherwise.
Environmental Investments Initiatives
1 if the company reports on making proactive environmental investments or expenditures
to reduce future risks or increase future opportunities, 0 otherwise.
Environmental Partnerships
1 if the company reports on partnerships or initiatives with specialized NGOs, industry
organizations, governmental or supra-governmental organizations, which are focused
on improving environmental issues, 0 otherwise.
Adaptation
Policy Water Efficiency
1 if the company has a policy to improve its water efficiency, 0 otherwise.
Targets Water Efficiency
1 if the company set targets or objectives to be achieved on water efficiency, 0 otherwise.
Land Environmental Impact Reduction
1 if the company reports on initiatives to reduce the environmental impact on land
owned, leased or managed for production activities or extractive use, 0 otherwise.
Biodiversity Impact Reduction
1 if the company report on its impact on biodiversity or on activities to reduce its
impact on the native ecosystems and species, as well as the biodiversity of protected
and sensitive areas, 0 otherwise.
Climate Change Commercial Risks Opportunities
1 if the company is aware that climate change can represent commercial risks and/or
opportunities, 0 otherwise.
Environmental Restoration Initiatives
1 if the company reports or provides information on company-generated initiatives
to restore the environment, 0 otherwise.
Source: Authors' analysis of LSEG Workspace data ().
[i] Note. Section 3.2.2 details our methodology for categorizing items as either mitigation
or adaptation. While mitigation items were relatively straightforward to classify
(showing a clear 60/40 distribution favoring mitigation with high inter-rater agreement),
adaptation items proved more challenging. Adaptation items exhibited a narrower 52/48
distribution favoring adaptation, accompanied by greater score dispersion.
Appendix 4. Calculation of the normalized weight of the mitigation index and the adaptation
index
Calculation of the normalized weight of the mitigation index
Total sum of yes responses to the item by year=
Total sum of yes responses for all items =
Weighted calculation
Dampened weighting calculation
Normalized weighting calculation
Calculation of the normalized weight of the adaptation index
Total sum of yes responses to the item by year
Total sum of yes responses for all items
Weighted calculation
Dampened weighting calculation
Normalized weighting calculation
Appendix 5. Summary statistics by sector, weighted by income of the selected variables
2017, 2021, 2023
Source: Authors’ elaboration using data from LSEG Workspace (LSEG, 2024).
Variable
n
Mean
S. D.
Min
Max
n
Mean
S. D.
Min
Max
n
Mean
S. D.
Min
Max
2017
2021
2023
1 Agriculture
Emissions int
0
2
13.5
0.0
13.5
13.5
2
13.0
0.4
12.7
13.3
Water int
0
1
17.3
.
17.3
17.3
1
17.2
.
17.2
17.2
Emissions
0
2
13.0
0.0
13.0
13.0
2
13.3
0.5
13.0
13.6
Revenue
2
750.7
275.1
487.1
894.3
2
1021.3
313.7
739.1
1195.7
2
1045.6
124.2
950.0
1126.3
Mitigation
2
0.0
0.0
0.0
0.0
2
59.8
9.7
51.1
65.1
2
63.3
7.4
57.5
68.1
Adaptation
2
0.0
0.0
0.0
0.0
2
71.6
6.8
67.8
77.7
2
71.5
7.9
66.4
77.5
Market value
2
6.1
1.0
5.6
7.1
2
6.3
1.8
5.3
7.9
2
6.6
1.0
6.0
7.4
Cash Flow
1
4.8
.
4.8
4.8
2
5.0
0.3
4.9
5.3
2
4.6
1.1
3.9
5.4
Ebit
2
4.0
1.1
3.4
5.1
2
5.1
0.7
4.7
5.7
2
5.2
0.3
5.0
5.4
Return on Assets
2
-5.9
15.9
-14.2
9.3
2
19.4
5.4
14.5
22.4
2
21.5
17.6
8.0
32.9
Leverage
2
109.7
47.8
63.9
134.6
2
89.4
90.4
39.1
170.7
2
78.8
101.2
13.1
156.8
2 Mining
Emissions int
26
13.0
1.3
7.7
16.0
45
12.8
1.2
7.3
15.8
43
12.6
1.2
8.4
16.2
Water int
24
15.5
2.9
9.3
21.0
39
15.4
2.9
8.8
20.6
39
15.0
2.7
8.6
20.5
Emissions
26
15.1
1.8
7.0
16.4
45
14.9
1.7
6.3
16.5
43
14.8
1.7
8.0
16.4
Revenue
45
11340.4
10702.0
99.6
30261.7
45
17308.7
17051.5
53.9
43834.2
45
12442.6
11230.9
55.3
29845.4
Mitigation
45
57.7
26.9
0.0
93.6
45
75.9
12.3
34.7
93.4
45
75.5
13.4
36.7
90.5
Adaptation
45
58.2
27.1
0.0
91.4
45
81.9
20.0
19.3
100.0
45
85.7
18.3
20.3
100.0
Market value
45
9.0
1.3
5.3
10.5
45
9.3
1.5
3.7
10.9
45
9.4
1.4
2.9
11.1
Cash Flow
44
7.3
1.3
3.1
9.1
41
7.8
1.7
1.3
10.0
42
7.4
1.4
0.4
9.0
Ebit
45
7.3
1.3
2.6
9.2
42
7.9
1.7
-0.8
10.1
41
7.5
1.5
1.9
9.3
Return on Assets
44
8.3
4.2
-8.2
23.6
42
16.6
11.5
-29.2
32.6
45
9.1
6.0
-67.3
22.9
Leverage
44
88.5
54.8
7.1
231.3
44
86.3
70.6
0.0
331.9
44
98.9
80.8
0.1
351.3
3 Manufacture
Emissions int
40
12.6
1.4
8.0
15.2
53
12.6
1.5
7.2
15.3
51
12.1
1.4
9.0
15.6
Water int
38
15.1
1.4
11.6
21.7
52
15.7
1.9
9.5
22.1
53
15.3
1.5
12.0
22.3
Emissions
40
15.5
2.2
7.4
18.0
53
15.2
2.1
6.8
17.8
51
15.1
1.9
7.2
17.7
Revenue
53
30365.7
30639.6
85.8
79102.0
53
26769.2
26065.3
101.3
67600.3
53
28401.8
27799.3
79.9
73441.4
Mitigation
53
68.4
19.8
0.0
86.3
53
77.1
11.8
33.6
90.2
53
79.3
8.9
44.4
89.7
Adaptation
53
62.9
22.7
0.0
100.0
53
80.0
17.9
23.1
100.0
53
86.5
14.6
0.0
100.0
Market value
52
9.0
1.0
3.2
11.3
53
9.0
1.2
3.4
10.6
53
9.3
1.5
3.8
11.4
Cash Flow
47
7.3
1.4
1.6
9.4
52
7.7
1.6
2.7
10.2
46
7.4
1.9
3.7
10.3
Ebit
51
7.3
1.5
2.4
9.3
52
7.8
1.6
3.6
10.1
50
7.1
1.8
2.7
10.3
Return on Assets
53
2.8
5.1
-22.7
20.6
53
12.6
7.4
-7.8
35.5
53
6.1
8.8
-14.2
26.0
Leverage
53
297.4
1362.1
3.8
13516.3
53
208.2
281.4
3.8
2055.3
53
332.0
1293.9
3.2
12378.1
4 Trade
Emissions int
20
10.7
1.2
8.3
14.0
37
10.6
1.2
7.2
14.3
37
10.0
1.7
7.2
14.0
Water int
13
13.1
1.7
10.4
20.8
33
12.5
1.9
9.3
19.3
35
11.9
2.4
5.6
19.3
Emissions
20
13.3
1.3
8.2
16.2
37
13.0
1.5
6.5
15.7
37
12.8
1.8
7.3
16.3
Revenue
36
15783.8
8390.1
229.8
27064.1
37
14637.4
9181.6
229.1
29233.2
37
17249.8
11639.5
306.2
35857.3
Mitigation
36
49.4
30.1
0.0
85.0
37
70.8
15.1
18.3
90.5
37
78.3
9.9
53.6
93.4
Adaptation
36
40.6
36.7
0.0
91.4
37
61.6
24.8
0.0
90.5
37
68.1
15.4
0.0
100.0
Market value
35
8.9
1.7
3.8
10.7
37
8.7
1.6
4.5
11.1
37
9.0
1.6
3.4
11.2
Cash Flow
34
6.5
0.9
3.5
7.7
32
6.7
1.0
3.8
7.9
36
6.7
1.1
3.7
8.1
Ebit
35
6.6
0.9
1.1
7.6
34
6.5
1.2
3.9
7.8
35
6.6
1.1
1.7
8.0
Return on Assets
36
6.6
4.6
-5.4
21.3
35
6.7
9.2
-54.2
18.7
37
7.7
7.8
-23.8
35.8
Leverage
35
96.2
132.6
0.7
1204.0
34
127.2
140.5
34.8
977.7
35
199.7
356.3
27.2
1540.3
5 Services
Emissions int
12
10.5
0.8
5.8
13.6
18
10.5
0.7
5.5
11.8
18
10.35
0.88
7.87
11.13
Water int
11
11.8
1.1
9.8
15.6
15
11.1
1.2
4.9
15.8
16
11.37
1.10
5.39
15.62
Emissions
12
13.4
1.5
5.0
14.6
18
13.2
2.0
4.4
14.8
18
12.78
2.02
7.21
14.61
Revenue
18
27891.0
21801.4
97.3
48222.8
19
18940.9
14957.9
129.4
32992.1
19
18005.20
14936.07
153.48
33005.40
Mitigation
18
62.9
21.3
0.0
80.7
19
71.5
9.5
40.7
89.0
19
69.19
12.41
42.34
90.16
Adaptation
18
47.8
22.2
0.0
74.6
19
52.9
16.6
19.3
90.5
19
57.10
12.45
20.34
90.81
Market value
18
8.7
4.1
-4.8
10.9
19
9.2
2.9
-4.7
11.1
19
9.35
2.20
-0.10
10.97
Cash Flow
17
8.1
1.5
1.9
9.1
18
8.0
1.5
3.4
9.1
17
7.85
1.57
3.44
9.19
Ebit
16
7.6
1.2
4.2
8.5
18
7.3
1.8
2.4
8.8
18
7.42
1.73
1.32
8.82
Return on Assets
18
6.0
11.2
-8.3
54.4
18
5.2
4.5
-15.3
28.4
19
2.96
8.34
-25.14
35.89
Leverage
16
230.0
157.0
2.0
359.4
18
152.0
125.8
4.9
687.4
18
156.74
121.84
2.62
606.61
Source: Authors’ elaboration using data from LSEG Workspace ().
Appendix 6. Estimation of the structural model of emissions and water intensity, company
value and mitigation and adaptation actions
Source: Authors’ elaboration. Standard errors in parentheses.
Source: Authors’ elaboration. Standard errors in parentheses.
Note. ** p<.01
* p<.05
Weighted by emissions. As a robustness check, we substituted the market value variable
with Tobin's Q (column 1). The results, though differing in magnitude, align with
those in Table 2.